

A service desk dashboard can only report the data it has. Response time, resolution time, backlog, and ticket status all start when an employee files a ticket and stop when someone closes it. So what happens on either side of those two events?
The Buchanan Technologies 2026 IT Experience Gap Report asked 850 U.S. non-IT office workers who’d contacted their workplace IT in the previous three months what they do when something breaks and what’s left after a fix doesn’t hold. Most respondents trust their IT teams. The gap the survey found sits in the record those teams rely on, where a large share of employee friction never shows up or only shows up in a form that doesn’t match what actually happened.
About the Buchanan Technologies 2026 IT Experience Gap Report
The Buchanan Technologies 2026 IT Experience Gap Report was conducted in July 2026 via Pollfish among 850 employed U.S. non-IT office workers who had contacted their workplace IT support within the previous three months. It measured how employees report problems, what happens when a ticket closes without a resolution, and which improvements the users value most.
Key Findings of the Buchanan Technologies 2026 IT Experience Gap Report
- Many problems never get reported. 82% have decided an IT problem wasn’t worth reporting, and half do it more than half the time.
- The ticket record is incomplete. 92% have done at least one of three things that leave the record incomplete or inaccurate: skipped reporting a problem, used their own tool or AI, or filed a duplicate ticket. 78% have done at least two.
- Self-service is a default for some. 72% have used their own tool or AI instead of IT, including 26% who say it’s their go-to move.
- Closure and resolution aren’t the same event. 80% have had a ticket marked resolved while they believed the problem remained, and 24% are still relying on a workaround or gave up.
- The friction reaches the work. 66% have lost personal time to an unresolved IT problem, and 56% have missed a deadline or deliverable.
- Speed alone is almost nobody’s ask. 94% chose at least one experience-quality improvement. Only 6% chose faster response and resolution without one.
- Trust in IT is high. 81% are completely or fairly confident their IT support team will solve their problems, which suggests the gap is about visibility more than performance.
Eighty-two percent have decided an IT problem wasn’t worth reporting, and half do it more than half the time, so none of those issues reach a ticket queue.
Seventy-two percent have used their own tool or AI instead of going through IT, and 26% say that’s now their default. Seventy-one percent have filed a brand-new ticket for a problem they’d already reported instead of following up, including 11% who do it most or every time. That adds a ticket to the count while resetting the clock on an older problem. Taken together, 92% of workers have done at least one of these things, and 78% have done at least two.
Problems that do get reported don’t always arrive the way they happened. Seventy-four percent selected at least one behavior that changes how or where a problem enters the system: 33% called or walked over instead of filing a ticket, 29% used words like “urgent” or “blocking my work” when it didn’t apply, 28% copied a manager, 19% exaggerated severity, and 15% downplayed it. Forty-eight percent said they’ve described a problem exactly as it was, but only 18% did that and nothing else.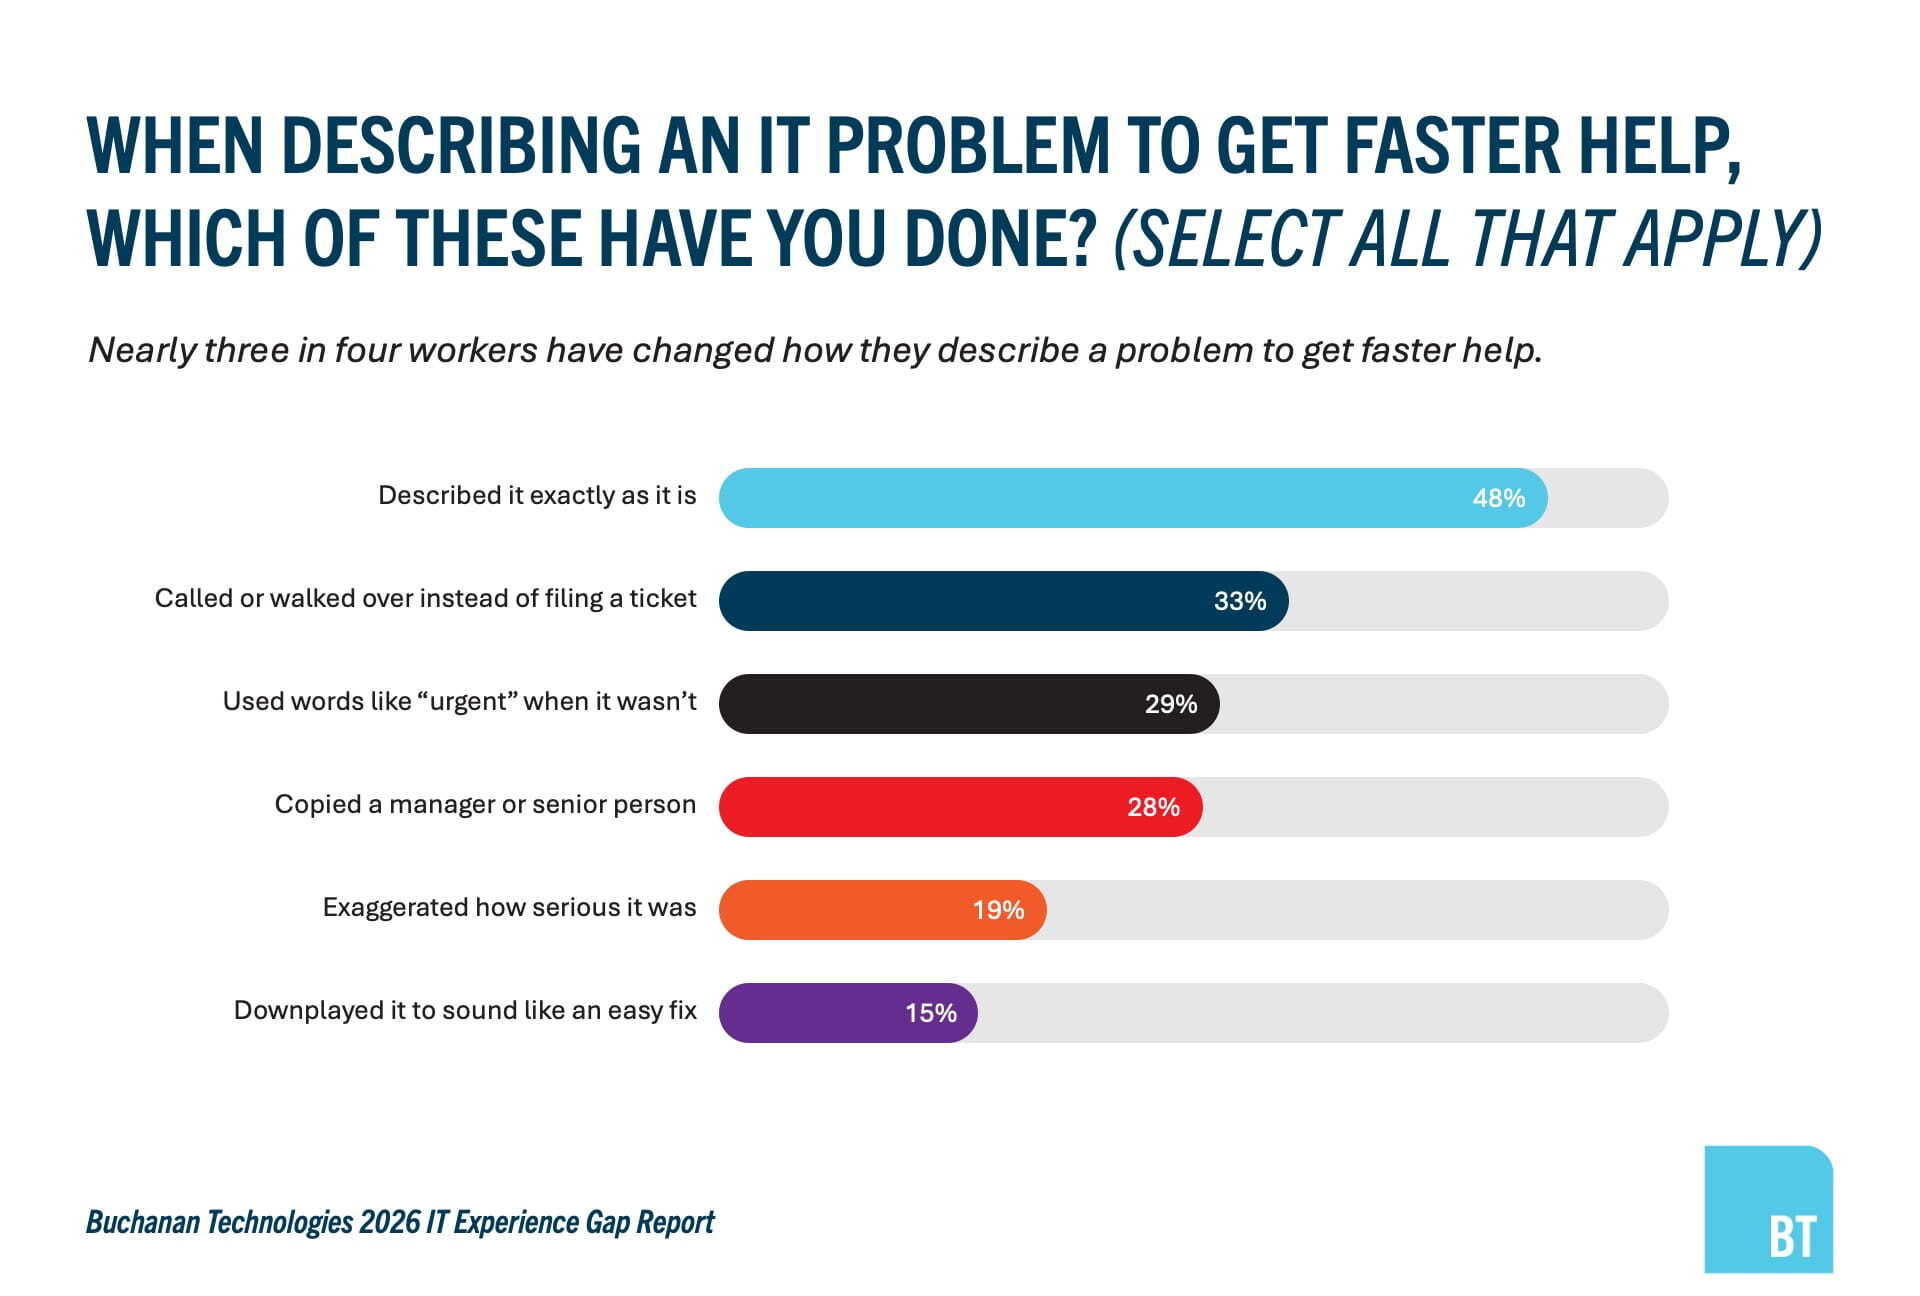
Eighty percent have experienced a ticket marked resolved while they believed the problem remained, including 17% who say it happens most or nearly every time. That’s the employee’s sentiment, not an audit of closure criteria. Both can be accurate at once, and the gap between them is what a status field can’t hold.
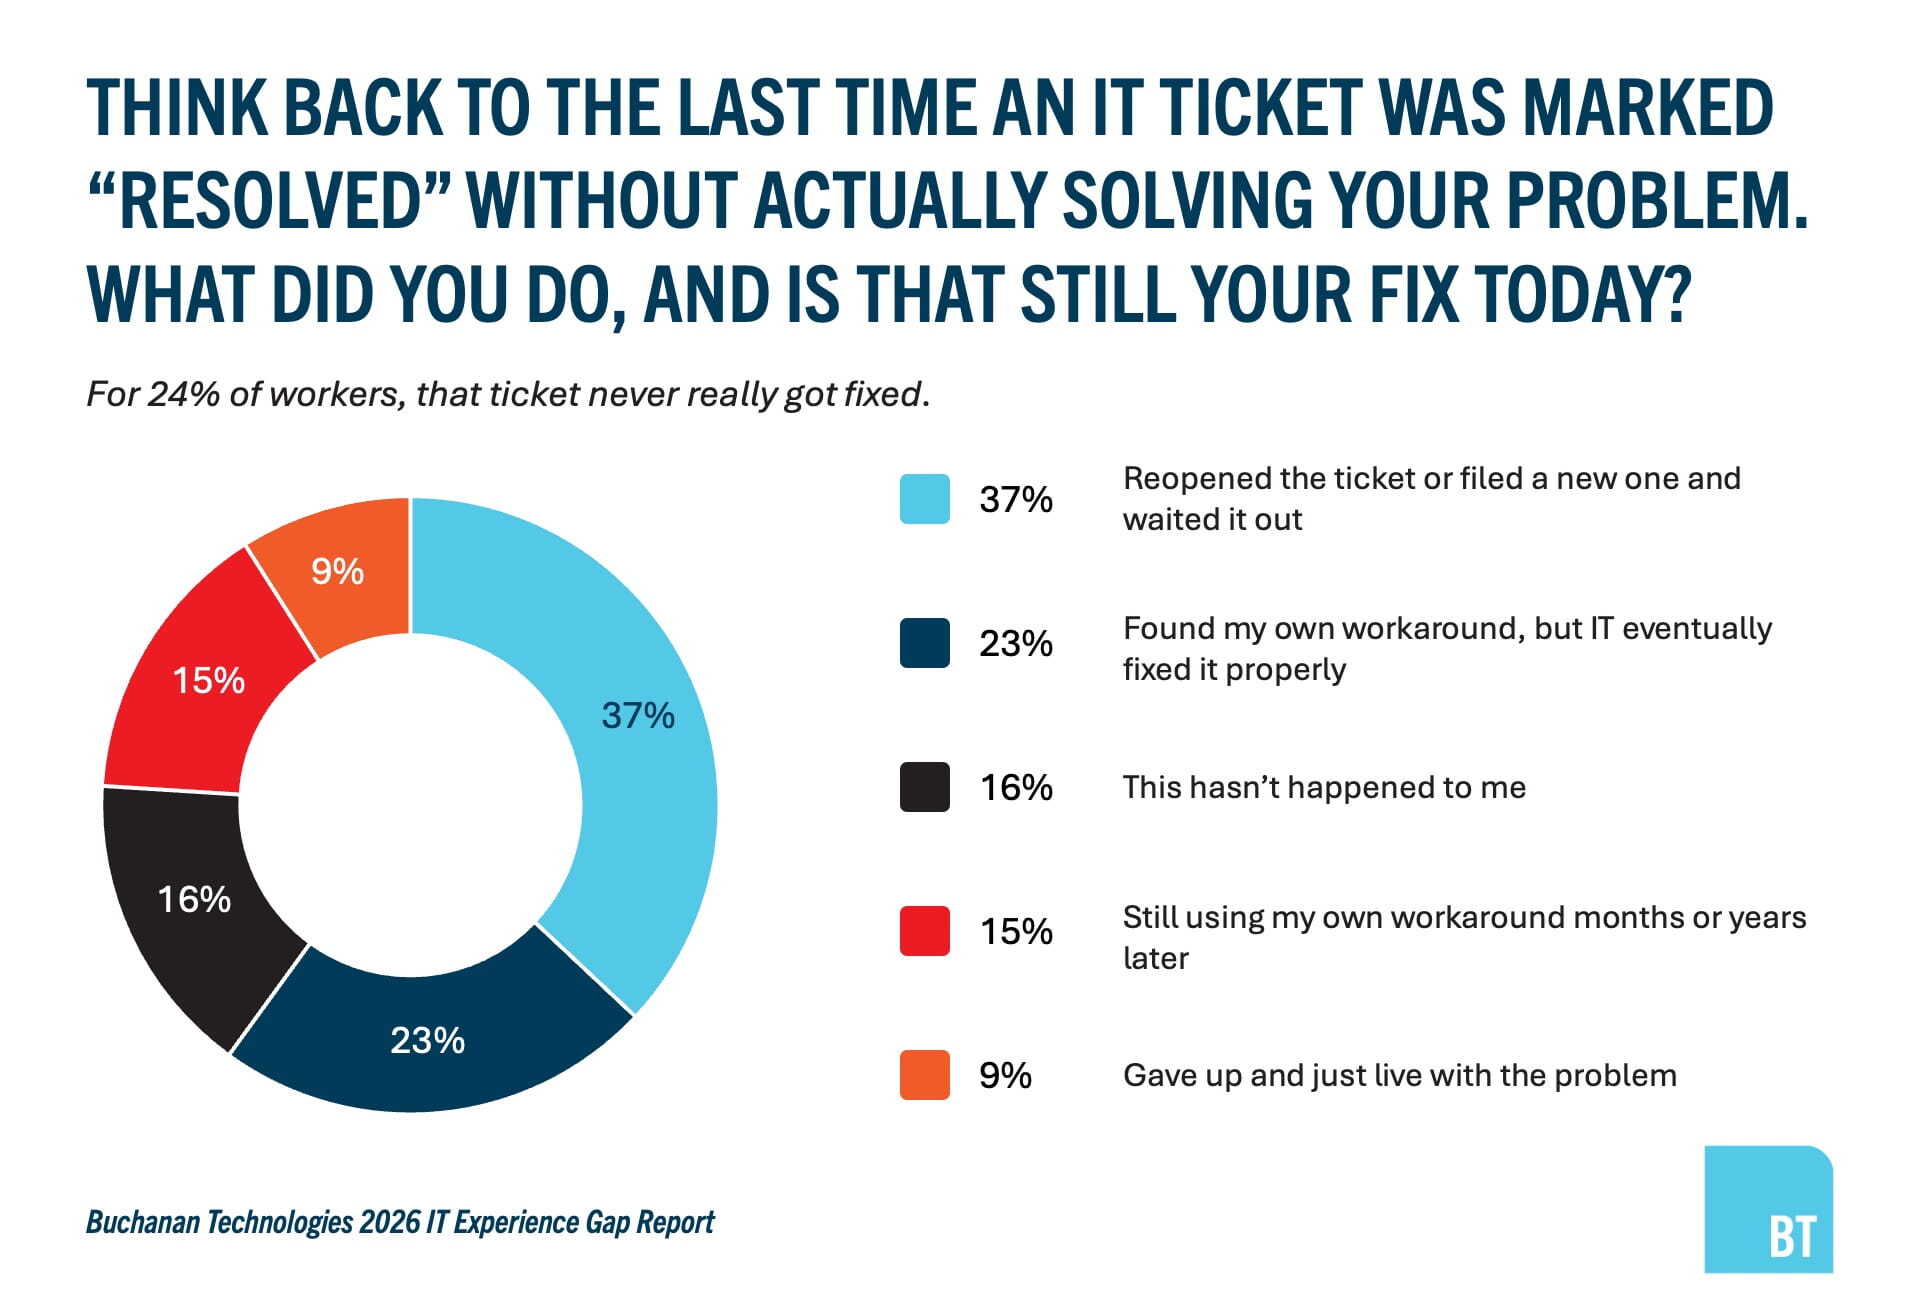
After a closure that didn’t hold, 37% reopened the ticket or filed another and waited it out. Twenty-three percent built a workaround and IT eventually fixed the problem properly. For 24%, their IT issue ended up somewhere other than the “resolved” folder: 9% simply gave up, and 15% are still relying on their own workaround.
Handoffs can add complexity and frustration for the user. Fifty-five percent explain the problem from scratch most or every time an issue moves from a chatbot to a person or between support tiers. When asked why tickets get closed prematurely, 36% pointed to a focus on internal metrics, 29% to time or staffing, and 29% to tools or process. Together, these responses suggest employees see premature closures as a broader support-model issue, shaped by performance priorities, capacity, tools, and processes, rather than a single point of failure.
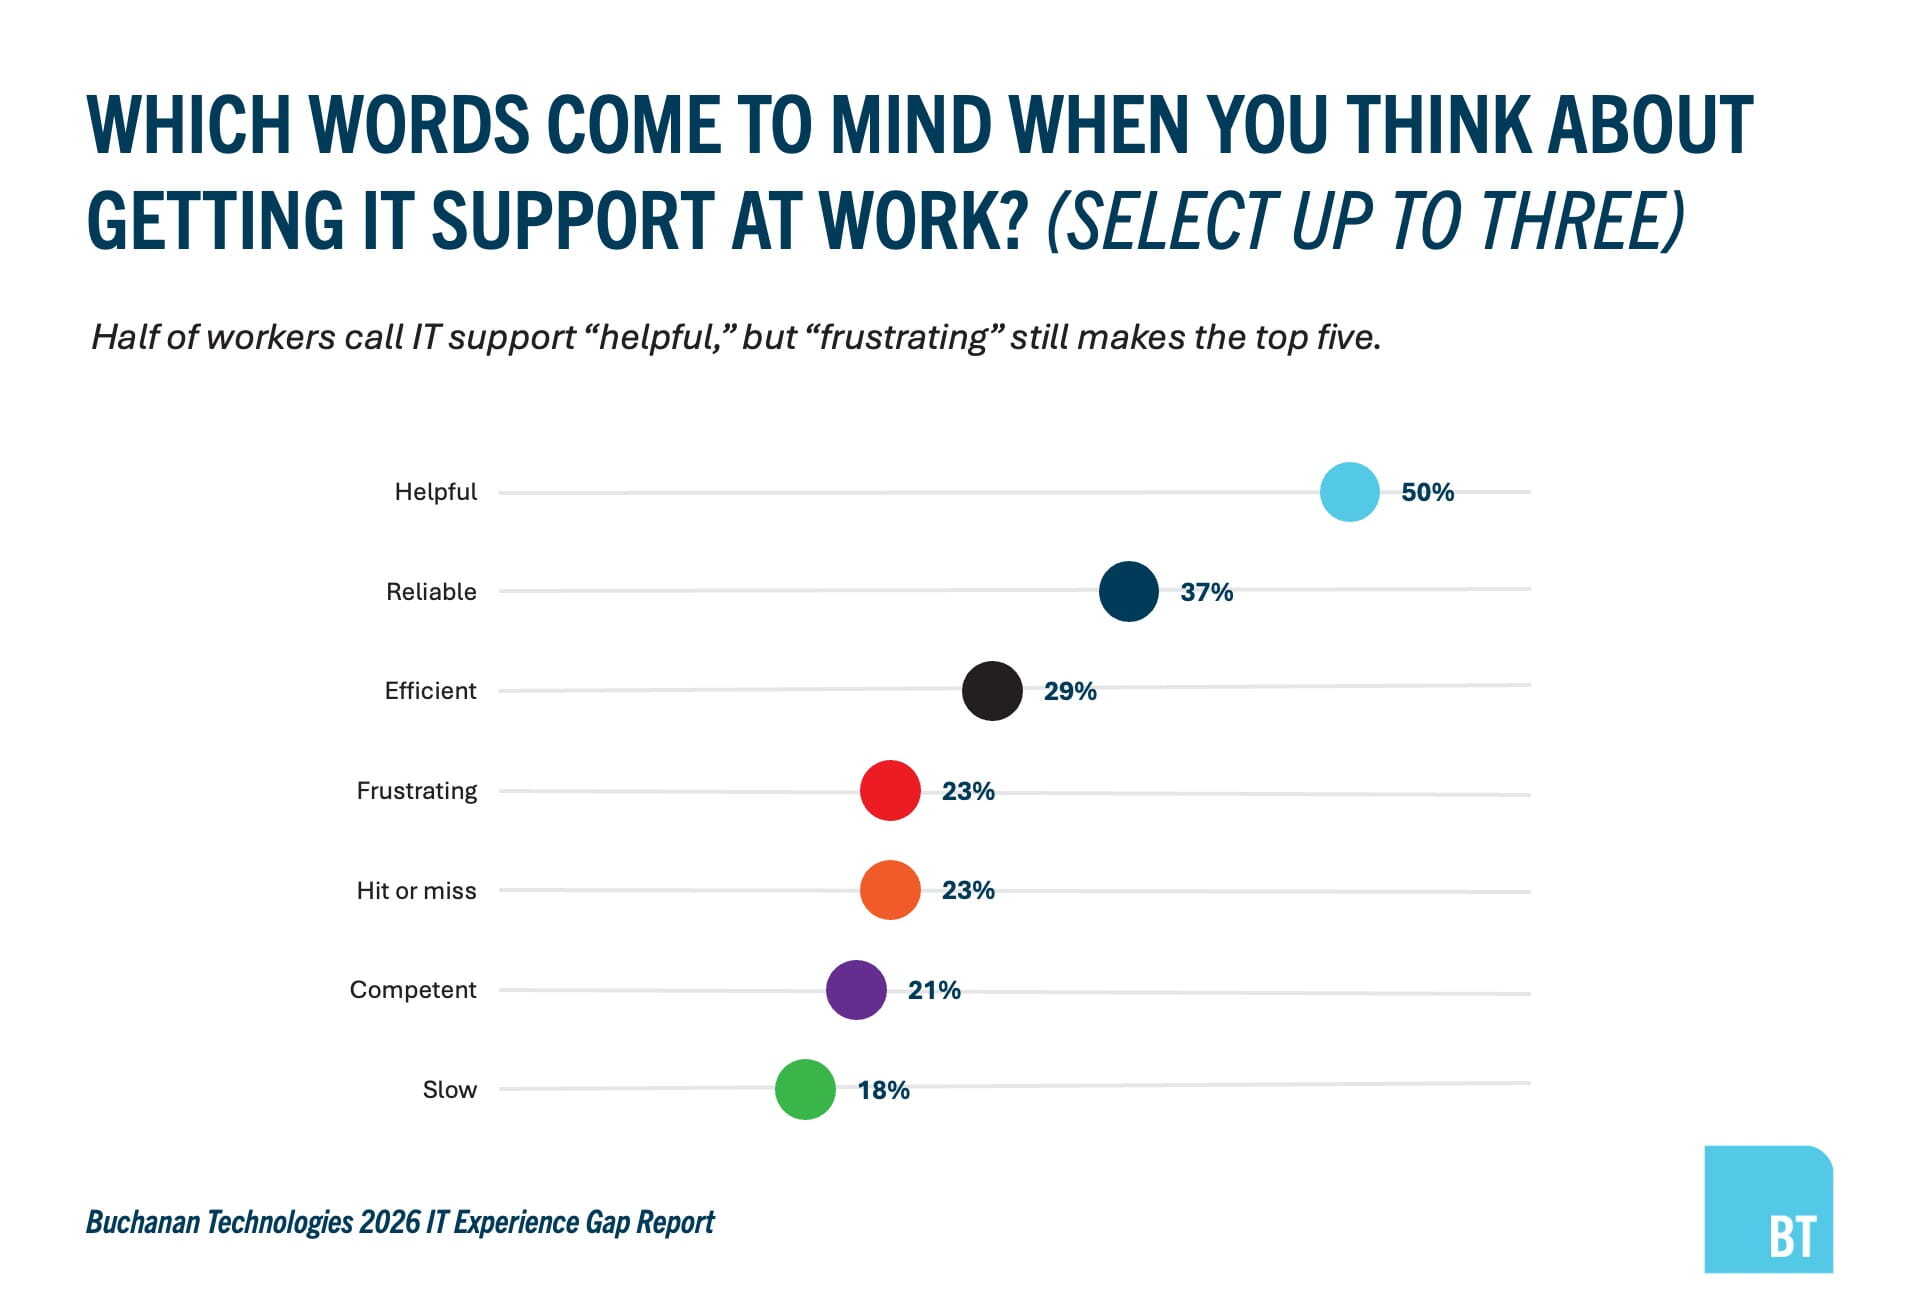
By most measures, employees rate their IT teams well. Thirty-five percent reported complete confidence in their IT team’s ability to solve a problem and 46% were fairly confident, for a combined 81%. Nine percent weren’t confident. “Helpful” was the most-selected word to describe IT support at 50%, followed by “reliable” at 37%, “efficient” at 29%, and “competent” at 21%. Negative words came up less often: “frustrating” and “hit or miss” tied at 23%, and “slow” came in at 18%.
That confidence hasn’t closed the gap. Thirty-nine percent said their support experience got better over the past 12 months, 51% said it stayed the same, and 8% said it got worse. Among reasons for the change, better tools or a more responsive team led at 23%. Yet the workers who say service improved are doing the same things as everyone else. Of the 39% reporting a better experience, 83% still decided a problem wasn’t worth reporting, 82% still used their own tool or AI, and 83% still had a ticket closed while they believed it was broken.
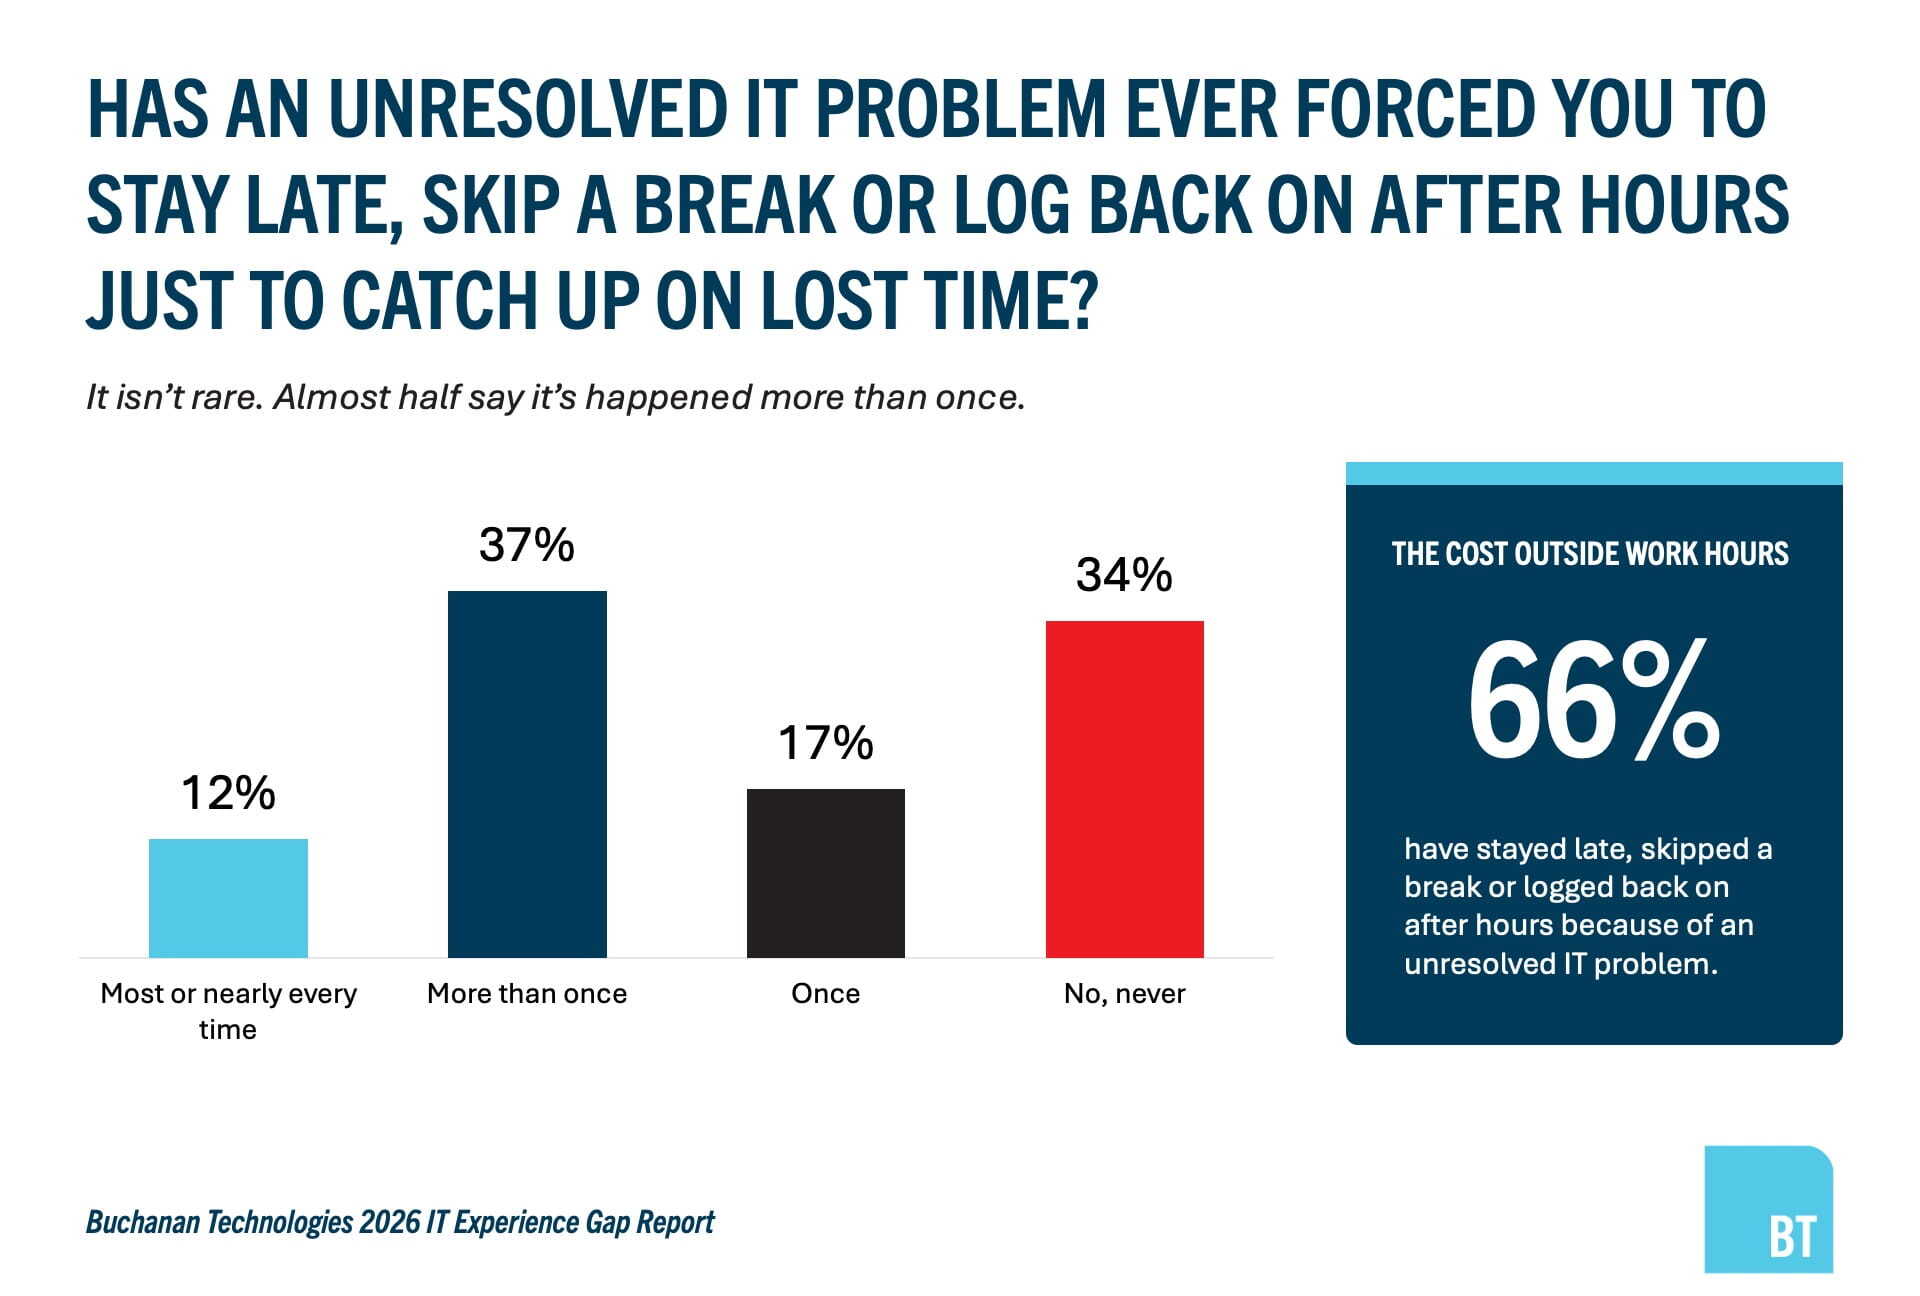
The time comes out of employees’ own hours, affecting productivity. Sixty-six percent reported staying late, skipping a break, or logging back on after hours to recover time lost to an unresolved IT problem, and 56% have missed a deadline or deliverable.
Leadership has partial visibility. Fifty percent say company leaders understand somewhat but underestimate the cost, 15% say leadership has no idea, and 35% say leadership sees it clearly. Feedback also travels outside the support record. Asked about their instinct after a frustrating experience, 45% talk to a manager, 32% vent to coworkers, 31% look for their own workaround, and 18% file a formal complaint.
Asked what would matter most in IT support, 31% chose fixing the problem for good the first time, 28% faster response, 27% clear confirmation the fix worked, and 26% not re-explaining the issue. Only 6% picked speed on its own.
Friendlier communication from support staff ranked last, at 16%. Everything above it is an outcome: a fix that holds, confirmation it worked, one conversation instead of four calls.
Many service desk dashboards are built around speed, while employees are asking for quality. That’s useful for IT leaders, because every item ranked above speed can be measured. Whether the fix held. Whether the employee got confirmation. How many times they repeated themselves. Whether the problem was reported at all. That’s the layer an experience level agreement (XLA) covers. Service level agreements (SLAs) still define the operational commitments a service desk runs on, and XLAs sit alongside them to report the employee’s outcome. Organizations without a formal agreement can track the same things through digital experience management.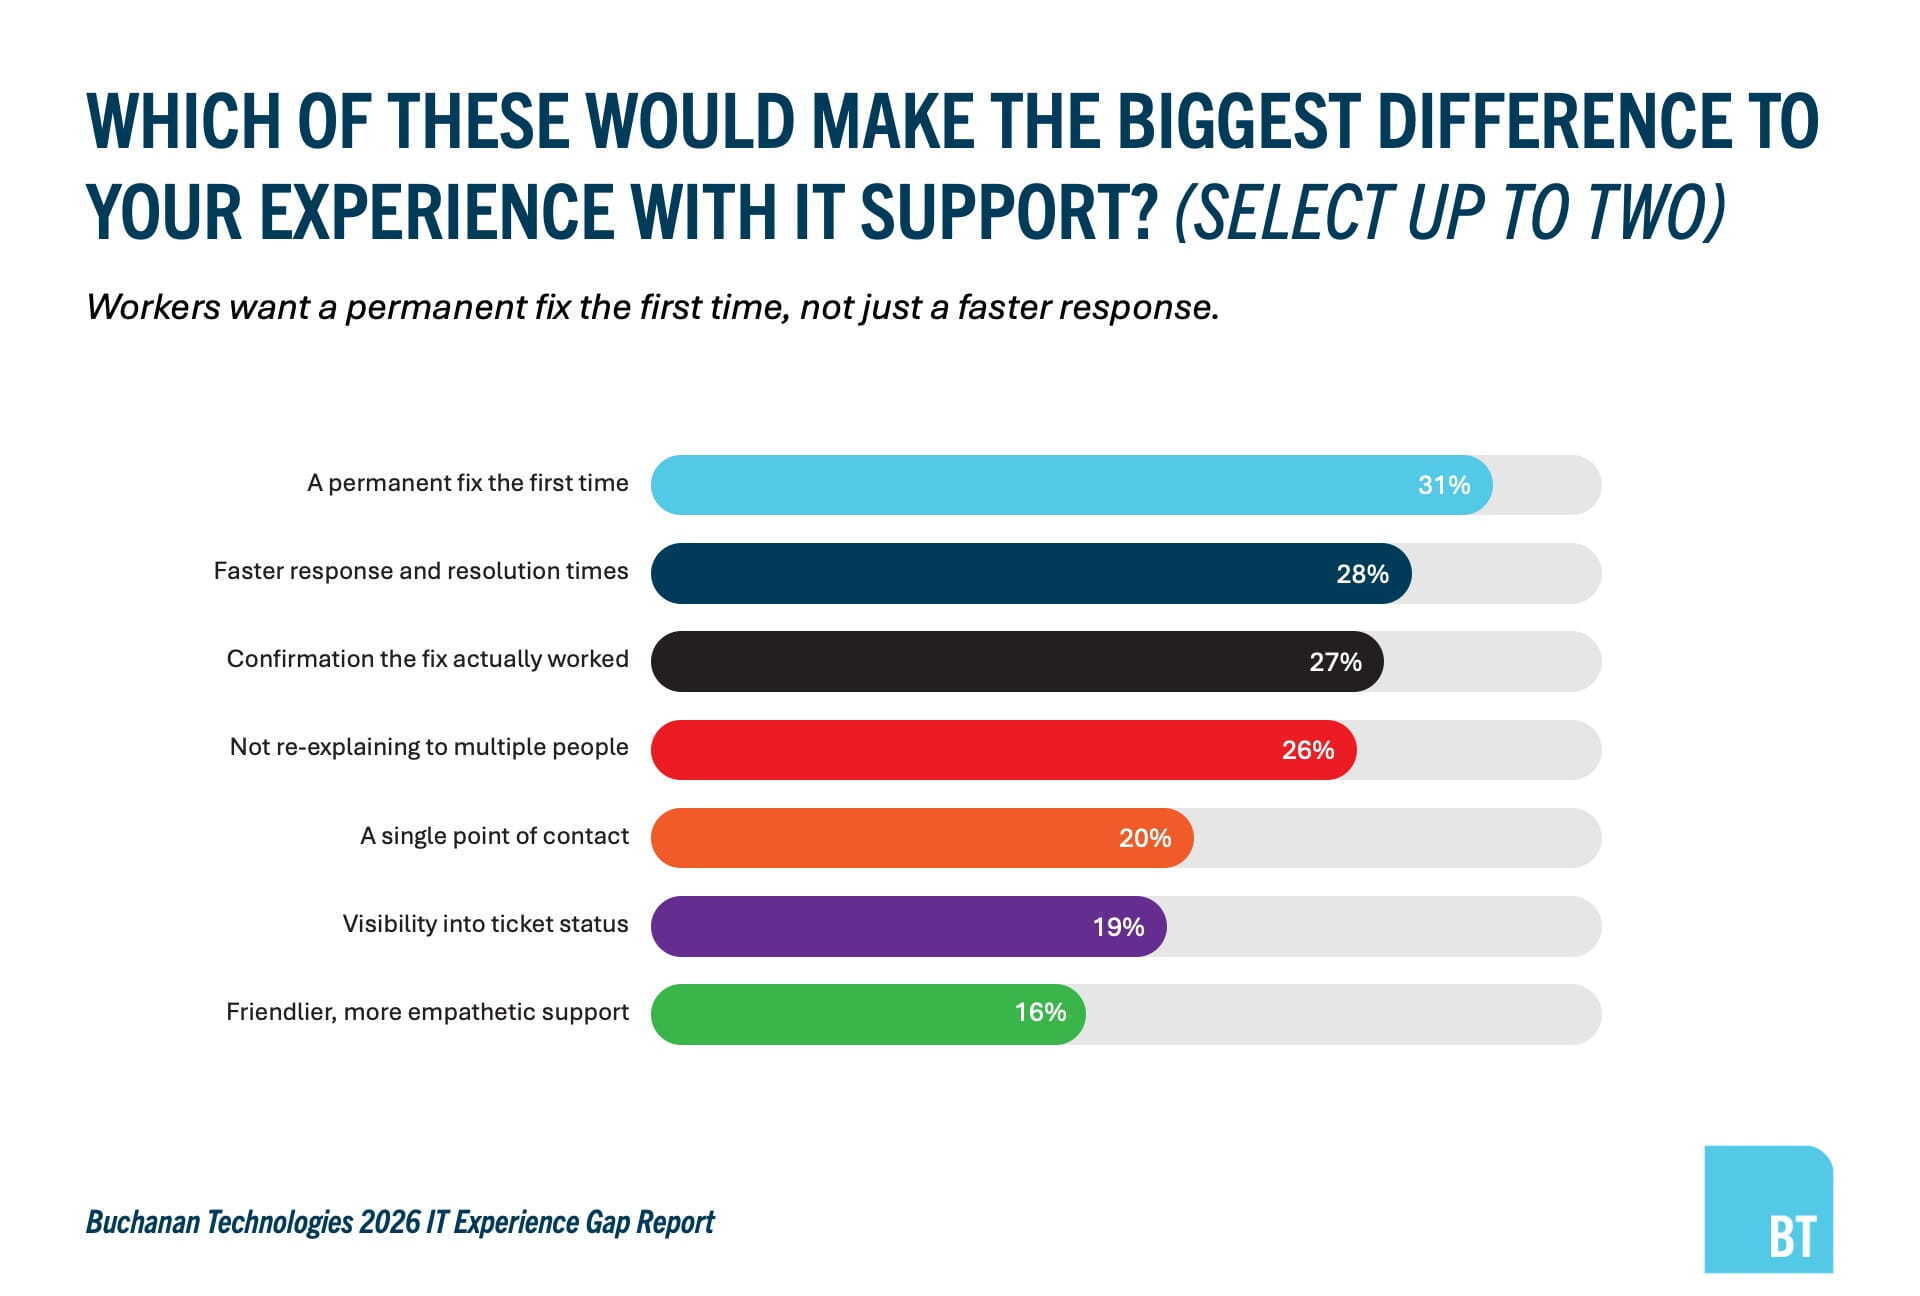
What IT Leaders Should Do Next
The Buchanan Technologies 2026 IT Experience Gap Report shows where the support record and the employee experience drift apart. Most workers trust their IT teams, and a quickly closed ticket still protects a service-level metric. What that metric can’t show is the problem nobody reported or the fix that didn’t hold.
For IT leaders looking to close that gap, Buchanan Technologies recommends pairing service-level agreements with experience-level agreements so support is measured on both speed and outcome. The recommendations below build on that approach using the survey findings.
Measure what never becomes a ticket.
With 82% of workers deciding at least one problem wasn’t worth reporting, a dashboard can miss a large share of the friction employees deal with. Short pulse surveys and digital experience monitoring can surface issues before anyone files a ticket.
Measure whether the problem got fixed.
A closure rate alone doesn’t answer that question. Tracking reopened tickets, duplicate tickets, and follow-up confirmation gives leadership a clearer read on whether support is working.
Make handoffs carry context with them.
More than half of workers say they repeat themselves most or every time an issue moves from a chatbot to a person or between support tiers. Carrying ticket history and prior troubleshooting steps across every handoff removes that burden from the employee.
Make the official channel the easiest one.
When workers can get a confirmed fix through IT as quickly as they could find one on their own, there’s less reason to turn to their own tools or AI.
Survey Methodology
Buchanan Technologies used the third-party survey platform Pollfish to conduct an online survey in July 2026 of 850 U.S. non-IT office workers who had contacted their company’s IT support within the past three months. Researchers reviewed all responses for quality control.